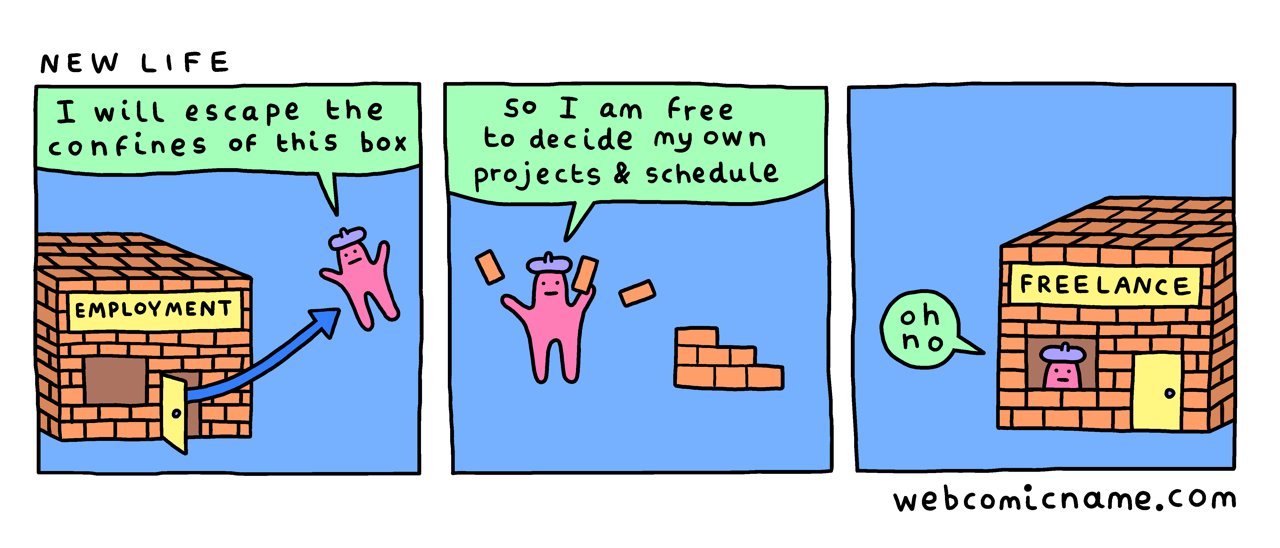
Power BI Desktop, the authoring tool, is completely free to use. Users can also create free accounts on the Power BI service, with a number of restrictions. In short, Power BI is free to get started, but if you want to do any serious professional work you are going to have to pay for a license.
Some pieces of Power BI are free and some aren’t. Parts that are available for free:
Power BI Desktop
Power BI Service (with limitations)
Power BI Mobile
Parts that are not available for free:
Enterprise sharing and collaboration
Power BI Report Server
Power BI Premium
Which parts are actually free?
Power BI Desktop
First there is the report authoring tool, known as Power BI Desktop. This tooling is completely free to use.
You will have to either create an account or deal with some mild nagging about signing up for a mailing list. You can disable that nagging with a registry change.
While Power BI Desktop is a great authoring tool, it is a terrible collaboration tool. If you were to live entirely in PBI Desktop, you’d have to pass around PBIX files which is incredibly clunky.
In my opinion, if you are going to look at using an on-premises, self-service tool you are better off using Excel. You still get a lot of the same capabilities with Power Query and Power Pivot, but inside of a tool people understand, and a tool Office 365 can render online.
Power BI Service
The Power BI Service, think powerbi.com, allows for free users. These free users can create reports and upload them, but with a significant number of limitations. The biggest is you only have one way of sharing content to others. Specifically with Publish to Web, which essentially makes your entire report free to the public.
You also only have one way of privately consuming other people’s reports, and that’s if someone places content in Power BI Premium. Otherwise, other users can’t share their reports directly with you. Power BI Free users are truly and island to themselves.
One other thing worth nothing is that you can’t sign up with a personal email. David Eldersveld has a good blog post on the issue. As of this writing, the uservoice request to change this has 2,800 votes.
See here for some more limitations of the free version of Power BI.
Power BI Mobile
Power BI Mobile is a way to consume Power BI Reports on Apple, Android and Windows mobile devices. Here is a picture of Power BI Mobile on my phone.
Which parts aren’t free?
Enterprise sharing and collaboration
Power BI is, by design, a collaboration tool. It is designed for people to publish and share their reports. If you want to take advantage of content curation using app workspaces, you’ll need to pony up and pay for a Power BI pro license.
If you are doing any real work with Power BI, you are going need to pay for a license for yourself as well as any report consumers.
Power BI Report Server
In addition to Power BI Pro, there is Power BI Report Server, which is the on-premises solution for hosting Power BI Reports. If you decide to go with Power BI Report server instead of making use of the Power BI Service, then you are going to need to pay for SQL Server Enterprise as well as Software Assurance. Alternatively you could pay for Power BI Premium.
Power BI Premium
Power BI premium is an alternate licensing model where you are licensing the content instead of the users. Once you have 500 or more users, it starts to make sense. Until then, the $5,000 per month is pretty pricey. It has other benefits as well, such as paginated reports and incremental refresh.
Summary
Some parts of Power BI is Free, but once you want to share with others, use more advanced features, or alternate deployment options, you are going to have to start paying.
Matthew Roche recently blogged about his struggles with mental illness. I applaud his courage, because it’s easy to worry what people will think about you. More recently, a member of the SQL Community took her life, and frankly the thought scares the shit out of me. It scares me, because some day that could be me. In fact, it’s been a recent point of discussion with me and my wife.
I write this post because I hope that if you are struggling with these feelings, you will get help. Please do something, because there are people that love you and would be devastated if you left this world. Here is what depression looks like and what I do to stave it off.
What is depression?
The English language does us a disservice in that the word for what is a crippling mental illness is the same word we use casually for being bummed out or sad. And while there is a spectrum, with there being things such as dysthymia or anhedonia (lack of pleasure), depression is often accompanied with what are called cognitive distortions.
If you think “I’m a failure”, that is a cognitive distortion, that is just factually wrong. You may have failed at a thing, but we are multifaceted, changing people. Depression is a matter of being disconnected with the reality at hand.
So what does the difference look like? We all get sad sometimes. Sadness is a good thing, grief is a good thing. These are healthy responses to difficulties in life. Victor Frankl, when writing about being in a concentration camp wrote, “An abnormal reaction to an abnormal situation is normal behavior” . To never feel sadness or grief would be abnormal.
Here is a picture of what healthy grief looks like:
Depression is very different. It is an auto-immune disorder of the mind. It is very commonly accompanied with negative thoughts that are pervasive, persistent and pessimistic. Common themes are feelings of helplessness, hopelessness, worthlessness, and suicidal ideation.
Here is a picture of what depression feels like:
If you are uncertain if you are depressed, take this depression checklist. It’ll take 5 minutes and may reveal something you are uncomfortable admitting. I took it just took it now, and today I am a 14 out of 100, or mild depression. There have been days when it’s been in the mid 30’s, or moderate depression.
Open Source Mental Health performed a survey of 1570 people in technology. Of those who answered the questions, 78% indicated they had a mental illness and around 70% of those indicated that they had a mood disorder such as depression or bipolar. We work in a field that often requires us to be on call or can make stressful demands on our lives. It’s more common than you might think.
It needs treated
I have a disease that requires daily treatment and medicine. My body doesn’t produce the chemicals I need. If I don’t treat it on a regular basis and monitor myself, someday I might die. That disease is called diabetes.
That’s right, I take insulin because my body stopped producing it years ago. I don’t think of myself of weak or less than because my body doesn’t work the way it should. Depression is often the same. Something has gone wrong in the brain. It could be a chemical imbalance, traumatic childhood events, or just a naturally lower set point for mood.
Whatever the cause, it still needs treated. It can be hard to admit and feel like a failing. I’m a guy, and I hate, hate, hate feeling like a burden to anyone. I hate asking for help. So much so, that when I was diagnosed with diabetes in the hospital, I told my now wife that I’d understand if she broke up with me. She just about slapped me. Boy was I dumb.
Get help. Please.
How I treat depression
Here are the ways I treat my depression:
Medication. Every single day, I take 10mg of Lexapro. I avoided it for a long time, I’ve heard horror stories about psych meds. I tried everything else, but eventually I decided I needed to take medicine.
The first month was hell and it takes 6 weeks to kick in. I had dry mouth and wanted to crawl out of my skin. After that my body acclimated, and the bleaker side of depression went away. I didn’t feels as dark and lethargic and hopeless. I still had negative thoughts and burnout, but I didn’t feel hopeless anymore. Many people have to try multiple medications to find one that works for them.
Exercise. The second most effective thing I’ve found to treat my depression is exercise, especially cardio exercise. I have to exercise every day, even if I’m sick. If I go a week without getting exercise, I start to get a resumption of symptoms. Exercise is as important as any of my other medications.
Sleep. Sleep is massively critical to good mental health. Sometimes I track my negative thoughts using a tally counter. A bad night’s sleep can double the number of negative thoughts I have in a given day. You wouldn’t give a SQL server 4 gigs of ram, why would you give your brain 4 hours of sleep and expect it to function properly.
Light. I hate the winters in Pittsburgh. It’s dark when you leave for work and it’s dark when you come home. I feel my symptoms most severely during the winter time. To deal with that I have lights everywhere. I have light alarm clocks, I have blue therapy lights to blast 1000 lux at my eyes and wake me up. I’ve even put hue lights in my room so my whole room lights up in the morning. The most effective thing is to just go outside, however.
Cognitive Behavioral Therapy. One of the most effective therapies is Cognitive Behavior Therapy. In short it identifies that it’s not just events that cause our emotional reactions, but also our beliefs about them. If you partner, come home late you could happy or sad depending on your beliefs.
CBT can be learned from books and I’ve found it to be effective. It feels a lot like having to catch your negative thoughts and then do a complex algebra problem, but I’ve gotten much better at labeling my automatic negative thoughts.
Meditation. Something new I’m trying is meditation. Those negative thoughts, or ruminations, can be hard to catch sometimes. They are like little mosquito bites. Independently, very small. But if you have 150 mosquito bites in a day, they add up. Meditation helps me catch myself and implement the CBT. I use the 10% Happier app and recommend the audio book. It’s fantastic and totally secular, if that’s your preference.
Biofeedback. Sometimes I count my negative thoughts with a physical tally counter. I think this week it was something like 30 -> 26 -> 22 -> 6 -> 7 -> 5 . I’ve had days where is was between 100 and 200. That’s a negative thought every few minutes.
I found that when I actually count them, I make more of an effort to catch myself and think healthier thoughts. Instead of thinking “I’m a failure” I think “I feel embarrassed.” Instead of thinking, “I hate myself”, I think “I feel scared and socially anxious.”
Social interaction. Depression is an isolating disease and IT can be an isolating job. Social interaction get’s us out of our heads and can be a source of support. Even just being at the library and near people can be helpful.
Talk therapy. While I’m not currently in therapy, I was for a while. I found it useful to be in a non-judgmental environment and have someone else I could bounce things off of.
Summary
While I have been in no way cured, there are a number of things I do to treat myself. There are a multitude of options you can take and a plethora of resources out there. Some of them may not work, but many of them are worth trying.
how to keep up with technology. When you are starting out with a technology, it’s just plain hard to get a lay of the land.
So, I thought I’d put together a learning path for Power BI, a technology that changes literally every month. This is a bit of challenge because there are so many moving parts when it comes to Power BI. Accordingly, let’s break down those moving parts into different categories.
So, when I think about Power BI, I like to think about the flow of data. First we have the Data prep piece with Power Query, where we clean up dirty data. Next we model the data with DAX. I’ve written before about the difference between Power Query and DAX. They are like peanut butter and jelly and compliment each other well.
Now, if you are a SQL expert, you may not need to worry about Power Query or DAX much. Maybe you do a lot of the work in SQL. But either way, once your data is modeled, you need to visualize it in some way. You need to learn how to create your reports with Power BI Desktop. Once your report is created, you then need to publish it.
Finally, there is what I would call the IT Ops side of Power BI. You have to install an on-premises data Gateway to access local data. You need to license your users. You need to lock down security. All of these things might be outside of what a normal BI developer has to deal with, but are still important pieces. However, unlike the data flow model we talked about, the ops pieces happens at all of the stages of development and deployment.
With that overview in place, let’s get on to the individual sections and the learning paths as a whole.
Getting started with Power BI
When it comes to getting started with Power BI, I have two recommendations. First get your hands dirty, and secondly buy a book. Power BI is in many ways an amalgamation of disparate technologies. It took me a long time to to understand it and it didn’t really click until I took the edX course and did actual labs.
The reason I say to buy a book is this is a technology that is hard to learn piecemeal. When you are starting out you are much better off having a curated tour of things.
Search Youtube for Dashboard in an Hour. This is a standardized presentation that will show you the basics in under an hour.
Follow the guided learning. This will walk you through bite sized tasks with Power BI.
Take the edX course. It has actual labs where you have to work with data inside of Power BI.
Check out the Introducing Microsoft Power BI book from Microsoft Press. It’s a bit dated at this point, but it’s free and is a great start.
Check out the Power BI: Rookie to Rockstar book from Reza Rad (b|t). The last update was July 2017, but it’s also very comprehensive and good.
Paid resources
Stacia Misner Varga (b|t) has a solid course on Pluralsight. It’s worth a watch.
Consider reading the Applied Power BI by Teo Lachev (b|t). It’s a real deep dive which is great, but can be a lot to take in if you are just getting started. A neat feature is that it’s organized by job role.
Learning Power Query and M
When it comes to self-service data preparation, Power Query is THE tool. The way I describe it is as a macro language for manual data manipulations. If you can pay someone minimum wage to do it in Excel, you can automate it in Power Query. Again, check out this post for the differences between Power Query and DAX.
Free Resources
Start with the guided learning. This quickly covers the basics
Matt Masson has a phenomenal deep dive video on the Power Query formula language, a.k.a M, from a year ago. It really helps elucidate the guiding principals of Power Query and M.
Blogs to check out:
Imke Feldmann (b|t) regularly has complex functions and interesting transformations on her blog.
Ken Puls (b|t) focuses on Excel and along with that, Power Query.
Gil Raviv (b|t) often has neat examples of things you can do with Power BI and Power Query.
Chris Webb (b|t) regularly dives into the innards of Power Query and what you can do with it.
Paid Resources
Ben Howard (b|t) has a Pluralsight course on Power Query. It’s a bit introductory, but great if you are just getting started.
Gil Raviv recently (October 2018) released a book on Power Query. What I really like about this book is it has more of a progression style instead of a cookbook kind of feel.
Ken Puls and Miguel Escobar (b|t) also have a book on Power query that has a cookbook feel. I found it helpful in learning Power Query, but it’s heavily aimed at excel users.
Finally, Chris Webb also has a book on Power Query. He goes into a lot of detail with it. However, the 2014 publish date means it’s starting to get a bit old.
Learning DAX
I always say that DAX is good at two things: aggregating and filtering. You aren’t doing those two things, then DAX is the wrong tool for you. DAX provides a way for you to encapsulate quirky business logic into your data model, so that end users doing have to worry about edge cases and such.
The piece of Power BI that is most prominent are they visuals. While it’s incredibly easy to get started, I find this area to be the most difficult. If you are heavily experience in reporting this shouldn’t be too difficult to learn.
A really interesting book is The Big Book of Dashboards. While it doesn’t mention Power BI, it covers all the ways to highlight data and what really makes a dashboard.
Administering Power BI
Power BI is much more than a reporting tool. It is a reporting infrastructure. This means at some point you may have to learn how to administer it as well.
Free resources
Check out my post on all the different ways you can publish Power BI Reports.
One of the big challenges with Power BI is just keeping up. They release to new features each and every month. Here are a few resources to stay on top of things:
I’ve written before about how to keep up with technology. In the post, I describe 3 currencies we can spend to extend out learning: time, focus and actual money. As you get older, you start to get less time and even less focus, but your pay rate goes up. So, every year it becomes more and more important to learn on curation to find just the good stuff.
As part of that I’m starting my own curated mailing list for BI links. Power BI changes on a monthly basis and it’s such a pain to keep up with it. This week is the 3rd week so far.
So what’s the catch? Well, I’ll also be including whatever things I’m up to at the bottom of each email. So if you don’t like me, maybe don’t sign up, hah. Here is this week’s weekly BI 5:
David Eldersveld talks a bit about #MakeoverMonday. This sounds like a great community program and I always find making things pretty to be the hardest part.
Wolfgang Strasser is keeping track of all the November updates for Power BI. I keep seeing memes about this from Microsoft employees, so I’m expecting something big to drop at Pass Summit.
Ginger Grant continues her series on SSAS best practices. I love seeing posts about how to do things right instead of just how to do the basics. Great stuff.
Three years ago, I started learning about Power BI and I thought, “Man, this is a really crappy replacement for SSRS.” Three years later, that’s still true, it’s a crappy replacement for SSRS. But that’s missing the point. Microsoft’s ambitions are MUCH, MUCH bigger than replacing SSRS.
Let’s review the many tentacles of Power BI; or, Microsoft’s not-so-secret plan to take over the world.
Tentacle 1 – SQL Server
It is unsurprising that Power BI is often compared to SSRS. If you come from a SQL background, there is a good chance that you need to report on the data in your database in some way. While there are a multitude of tools available to do so, often it’s easiest to go with whatever Microsoft recommends. You already paid for it, right?
For many years, that was SSRS. And for half a decade, between 2010 and 2016, not much changed with SSRS. Much like some of the plants at the Phipps conservatory, it wasn’t dead…just dormant.
If you come from the SQL world, this is all old hat by now. Microsoft is investing a lot of time and money into Power BI, so it’s tempting to think that Power BI is replacing SSRS, but it isn’t. If we look at the traditional BI pyramid, Power BI and SSRS occupy two totally different strata.
SSRS is designed for things that need a page number on them. This is generally detail-heavy, pixel perfect kind of work. This kind of operational reporting is descriptive, it tells you facts, but doesn’t add a lot of spin. This is at the base of the pyramid
Once we have the business up and running, we can move from “is” to “ought”. What should we do? Where should we go? This kind of reporting is higher-level, less detail oriented. You are looking at the company as a whole or at multiple years of history. You may drill down deeper, but generally speaking someone else is sweating the small stuff. This kind of reporting is prescriptive and where we find Power BI.
Finally, once we are moving and we are moving in the right direction, we can be even more forward looking and make use of predictive analytics. What’s going to happen in the future? What can the data tell us? This is where tools like Azure Machine learning and R can start to help us.
Power BI and SSRS are aligning
Power BI and SSRS are aligning and getting closer. If Power BI was a drop-in replacement, I wouldn’t expect to see this. I would expect to see Microsoft heavily pushing one over the other and that’s it.
By contrast, look at SSAS tabular and multidimensional modes. Tabular is available in Azure Analysis Services and multidimensional mode isn’t. Yes, I know it’s on the roadmap but it’s definitely not a number one priority. Every time I hear about SSAS, people are talking about tabular mode. In economic terms, DAX and MDX are subsitute goods. Sales of one reduces sales of the other. Think Coke versus Pepsi.
Power BI and SSRS, on the other hand, are complimentary goods. Think peanut butter and jelly. Yes, they are both things you can put on your bread, but they go better together. Yes, I know that seems strange, but look at what’s going on.
Last year, they announced Power BI Report Server, which is basically SSRS server with Power BI rendering on top. This year they announced SSRS rendering in Power BI Premium. Now, whether you are on-premises or in the cloud you use Power BI and SSRS in the same place.
Give it another year, and I bet the alignment is going to get even closer. I bet they will add Power Query as a data input for SSRS, just you wait and see.
Tentacle 2 – CRM, ERP, and business data
Microsoft wants your business data and it wants it badly. Last week I spoke at the Phoenix Power Summit, and I was really out of my element because it was all about business. It was basically 5 conferences in one, focusing mainly on all of the dynamics products (AX, NAV, Great Plains and Dynamics 365).
It was strange walking around the 250 vendors and 4,000 other attendees. Out of everyone there I only knew 2 people. And what those 4,000 people represented was something that I had never fully considered: standing there was Power BI’s core audience. It’s not me and it’s probably not you. It’s Chris in accounting. Let’s meet Chris.
Say hi to Chris
When I first learned about Power BI I was confused. Why did I need Power Query? Why did I need DAX? I already had all this stuff. I had T-SQL and SSIS. And the truth was, those tools weren’t for me, they were for Chris.
So much of this stuff clicked when I came up with the persona of Chris in accounting. This is the kind of person who is great at vlookups, okay at SQL and is stuff in the land of spreadmarts, flat files and Access databases. This person understands the business intricately and just wants to get things done. And many time, she has almost no IT support to get her job done, so she has to make do with the tools she has. For her, Power BI is a life saver.
And walking around me last week was 4000 Chris-es from accounting. This is going to be big.
Microsoft shoots across the bow of Salesforce
It doesn’t take a genius to realize that Microsoft and Salesforce are direct competitors. Both were interested in buying Linkedin, and more recently Microsoft fired a warning shot to Salesforce.
At Ignite, Satya announced the open data initiative along with Adobe and SAP. Guess who isn’t in the picture? That’s right, it’s Salesforce.
Part of that announcement was them talking about the Common Data Service. When I first heard about CDS months ago, I was again confused. It sounded like some weird semantic layer for the data in Dynamics CRM. Maybe useful if your data lives in Dynamics 365, otherwise who the heck cares.
Oooooh boy was I wrong. Microsoft is aiming for something much, much more ambitious than an awkward pseudo-database layer for people who don’t like SQL. They are aiming for a common shape for all of your business data. They want to want to create a lingua franca for all of your business data, no matter where it is. Especially if it’s hiding in Salesforce.
Now, do I expect them to succeed? I’m not sure. I’ve learned the hard way that every business is a unique snowflake, even two business in exact same industry. But if anyone can do it, Microsoft has a good shot. They’ve been buying up CRM / ERP solutions for decades.
Tentacle 3 – Data Science, Machine learning and Azure
Last week I had the pleasure of attending the Phoenix SQL user group and listen to Matthew Roche talk about Power BI Dataflows. When I first heard about dataflows, like everything else in this space, I didn’t quite get it. It sound like Power Query, but for the Power BI Service directly? Weird.
The way Matthew described it made a lot of sense. Dataflows represent an intermediate layer for your data, much like a traditional data warehouse. This is after all of the boring ETL bits, but before all of the sexy BI semantic layer bits. This is, metaphorically, chopping all your broccoli and putting it into plastic bags. The end user still has to decide what the final product looks like.
And guess what shape they let you put your data into? That’s right, the common data service. Microsoft wants to act like as a clearing house for your data. They want to act as a middle man for all of your data sources and all of your data consumption.
One weird thing about dataflows is that it’s saving the results to flat files in a data lake. Now, it was about this point that the DBA in me started freaking out. Why are we storing things in flat files? Flat file databases are older than I am!
(Sidenote: SQL Server 1.0 is about 6 months younger than I am.)
Well apparently, that’s standard fare for data lakes and how they scale. But the part that excites me is all the avenues that opens up. Because you can Bring Your Own Storage Account and gain access to all of that delicious data.
This is some seriously cool stuff.
Summary
Power BI remains a poor replacement for SSRS. But it’s a fine compliment to SSRS and is a growing way to report on the data living in you SQL Server.
For business users, especially Dynamics 365 users, it represents a way to get at and visualize their data. Power BI, PowerApps and Flow represent a huge step forward for business users, especially those stuck living in spreadsheets and access databases.
Finally, Microsoft wants to Power BI and the Common Data Service to be a central hub for all of your business data and analytics. This is going to expand into providing easy ways to take your business data and pipe it into Azure Machine Learning or Azure Databricks.
My third Pluralsight course is out now, and it covers all the myriad ways of deploying Power BI:
Manual sharing
App workspaces
Content packs
Publish to web
Office 365 embedding
Power BI Premium
Power BI Embedded
It can be overwhelming all the different ways of deploying Power BI, but in this course I walk you through the smallest, self-service options all the way to the large, scalable options.
I recently quit my job so that I could make more courses, so if you like what I do, please go watch it. You are supporting my family by doing so!
This month’s T-SQL Tuesday invitation is to write about a project that went horribly wrong. And hoo-boy, do I have a project that comes to mind.
My biggest project was my biggest failure
The biggest project I ever worked on, that I ever led, was also my biggest failure. In many ways it has defined the early trajectory of my career and shaped what I value in my new career.
About 8 months into my previous job, my boss wanted us to move to a different ERP system. This would allow us to consolidate 5-6 different pieces of software into a single piece of software. The theoretical business benefits would be quite significant. No longer would we need to have this awkward patchwork of integrations between different line-of-business applications. And while we eventually did it, I consider it the biggest personal failure of my career. So what went wrong?
The software was built in-house
So the first issue was that the software was built in-house by another company in the same industry. Imagine, for example, if a large bakery had created an ERP system and another large bakery wanted to move to that system. Sounds great, right? Well, you run into two issues in that scenario.
First, a bakery is not an independent software vendor. Programming, by definition, is not their core competency. Which means that you may run into fragility or issues that you wouldn’t run into with a commercial piece of software. It also means that there isn’t going to be any documentation on migrating to the software or implementing it. Why would there be. If you built software for one company, why would you create scaffolding to move other companies onto it?
Second, not every business is the same. A lot of the fundamentals are the same, but you will run into many edge cases. We do invoices this way. They do workorders this way. We handle purchase orders this way. They handle inventory that way.
The way that I think about it is like a sea shell. It’s this intricate curve that’s grown over time, organically, to fit that creature. If you just try to fit a different snail or mollusk in that shell, it may not work out.
I was not qualified
This was my second real job ever and I had been working less than 2 years in the industry. I always tell people the jobs said .net / SQL developer, and it turned out to be a lot more SQL and a lot more DBA.
When I started that job, I didn’t know what a stored procedure was. I didn’t know what a view was. 8 months later, when this project started, I had never done any large scale integrations or migrations. At that point I had done some small integrations between pairs of systems, but nothing nearly at this scale.
Add on top of that the need to staff up and add someone to the team. So, about year in to my new job I was also now a manager.
The software stack was older and different
Because this software had started way back in the Apple II days and grown over time, much of the technology stack was quite old. The application was built on VB6, MySQL, Classic ASP, Crystal Reports 9 and Adobe Flex. This presented challenges in getting it up and running, as well migrating to it.
Migrating data from SQL server is a giant pain. MySQL workbench has an import wizard, which works decently well, but it can be a bit of tedious process. Later I was able to set up linked servers, but that involved looking up strange property settings and forcing char padding on MySQL.
The software made a lot of assumptions
Because it was homegrown, the software made a lot of assumptions about the data. Project numbers under 1000 were reserved for certain pay codes. Half of the columns would crash the software if they had null values. A lot of the tables had to be populated for the application to even run.
So, so, so much of the process was modify a view, migrate the data, see what blows up, repeat. This is a big part of what made the weekly data load so painful. So much of the migration work was sheer trial and error.
Migrating ERP systems requires understanding 2 businesses
Migrating from one ERP system to another in this case require understanding the business that created the software and the business intending to use the software. This is a lot of learning and a lot of weird edge cases. I think I deeply underestimated the sheer complexity of running a business and all the departments therein.
When we deployed, there was a whole chunk of functionality we hadn’t implemented because “certificate of work” meant one thing to use and something totally different to the other company. They whole system updated maintenance cycles based on these certificates, whereas we had assumed they we merely customer deliverables and thus optional.
What would I have done differently?
Ultimately the project took 13 months instead of the estimated 8, and even then that was only because I decided for us to have a hard cutoff at the calendar year. So, if I could travel back in time, what would I have told my younger self?
Tighten the feedback loop. Migrating the data from one system to another was a largely manual process and quite painful, so we only did it maybe a week. Near the end I had started automating the process. In retrospect, I should have made it a nightly process.
Learn SSIS and BIML. So much of the pain came from the slow turnaround cycle. I suspect that if I had learned SSIS, I could have made things into a daily or even hourly migration process and saved so much time.
Read Rapid Development. I wish I had a better idea of what I needed to know from the outset. Rapid Development was a revolutionary book for me and had so much good advice in it.
Identify a measurable list of use cases. When we made the cut-over, a number of basic things did not work because we hadn’t tested them. What would have been smart would be to have a checklist that we could run through before hand to test the use cases.
Don’t take it personally. I was young and I treated things outside of my control as my responsibility. I was sore for a long time about how things went, and I thought too much on how that reflected on me and my abilities.
So now what?
Even to this day, I’ve got a certain amount of skittishness around the idea of large projects. There is a whole suite of soft-skills, of methodologies involved in making sure an IT project is successful, and I’ve learned the hard way what happens when you don’t have those skills.
For now, I’m excited to focus on course authoring and projects where I just need to create content.
Finally, I’ll leave you with a favorite quote of mine:
Good judgement comes from experience. Experience comes from bad judgement.
This week we’ve got another episode of SQLChefs with Bert Wagner, where we talk about the different between datasets, reports and dashboards in Power BI.
What are datasets?
A Power BI Dataset is a series of Power Query queries that have been shaped in a DAX model. Each dataset can combine different files, database tables and online services all into one tabular model. In our cookie analogy, these are all different “ingredients”.
Unlike SSRS, a dataset in Power BI does not represent a single table or query of data. A dataset should be considered more like a “flavor” of data used to accomplish a specific type of reporting: financial, operational, HR, etc. So in our analogy, the dataset is the “raw dough”.
So in Power Query, you are going to have a set of queries which each combine a data source with a usually linear set of transformations.
Then, in DAX, you are going to take each of those outputs and combine them into a model. This consists of defining relationships between the outputted tables and adding business logic via calculated columns and measures.
For more on the difference between Power Query and DAX, see our previous episode of SQLChefs.
What are reports?
A power BI report is a series of visualizations, filters and static elements on a canvas. Power BI reports are saved as a single PBIX file and connect to a single dataset. Remember, a Power BI dataset can have many data sources.
Each report can have multiple sheets, just like an Excel workbook. In our analogy, this is us placing our “cookies” on multiple “cookie sheets” making one big batch, all of the same “flavor”.
One report per dataset
A quick aside to something that used to confuse me. In most cases, a report and a dataset are going to have a one to one relationship. A dataset can have one report and a report can have one data set.
Recently this has changed, however. A while back, they added the ability to use an existing dataset as a data source for a report. and at Ignite they announced the ability to share datasets outside of the app workspace they were made in.
That being said, while you are still learning Power BI, it’s easier to remember that in many cases, your dataset and your report are going to have a one-to-one relationship and be tightly linked.
What are dashboards?
In Power BI, dashboards are a way of pulling together visualizations from various reports. When you think dashboard, you are probably thinking something like Microsoft’s definition: “A Power BI dashboard is a single page, often called a canvas, that uses visualizations to tell a story. Because it is limited to one page, a well-designed dashboard contains only the most-important elements of that story.”
However, if you look at the report example above, it probably fits that definition. It is not a Power BI Dashboard. In Power BI, a dashboard is tool for pinning visuals from different reports and other sources of data.
In my opinion, a Power BI Dashboard is as much a tool for organization and navigation, as it is for actual reporting. I think that’s the real value add with Power BI dashboards.
If you are using R as a data source, you may want to be able to refresh the data or run that R script on a schedule. However, if you try to configure a On-premises Data Gateway to refresh the data source, you will see this error.
Extension{"extensionDataSourceKind":"R","extensionDataSourcePath":"R"}Cannot be added to gateway
Back in August 2016, Microsoft added support for refreshing R scripts but only for the personal data gateway. So, in order to schedule a refresh where you are using R, you need to install and configure an on-premises data gateway in personal mode. The Microsoft documentation for r query steps reflects this limitation as well.
I once had to some auditing for a customer and it was a complicated, multi-stage process. We had to be able to demonstrate who had admin access and what kind of activity was going on, on the server. But before we could do any of that, we first had to identify who was actually logging on.
Triggers to the rescue
So what are the different options for telling who is logging on to a a SQL server? 5 options come to mind:
Configuring login auditing really isn’t a good solution. What you are doing is changing the base settings to log successful logins in addition to failed logins. The problem is that these events are written to the SQL Server event log, which isn’t convenient to parse.
Well what about using a trace? Well I’ve always been told that traces are expensive in terms of performance so I shied away from using one of those. In retrospect, I doubt it would have been too expensive since it’s only tracing logins. If anyone knows, let me know!
The next option is to use Extended Events, which often have better performance. Unfortunately, this server was SQL Server 2008 R2 and there was no GUI support for extended events. So that wasn’t ideal.
What about SQL Audit? Underneath the hood, SQL Audit is just Extended Events. That being said, there is at least some GUI component to it. For 2008R2, it required Extended Edition. while that wasn’t an issue for us, it seemed like overkill.
So what’s the last option? Creating a server level trigger. This was simple to implement and easy to dump the data into a SQL table for reporting purposes.
Proceed with caution
So, what’s the downside. Wellllllll. What happens if you have an error in your code? If you hit an error, then you can’t login. At all. Anyone.
There are ways to resolve this issue, but it requires shutting down the SQL Server and taking an outage to fix it. Suffice it to say, I spent a looooot of time testing before I pushed this out to production.
Overall, triggers provided a simple solution to a simple problem. But the solution required a good dose of caution.