All posts by Eugene Meidinger

Are local credentials or passwords stored in the Power BI Desktop file?

When I presented on Power BI at Cleveland, I wrote up a blog post with all the questions I didn’t have an immediate answer to. I presented last week at Cincinatti and wanted to do the same thing.

This time there were some more difficult questions so I’m going to have to split it up into multiple blog posts.

Are local credentials stored in the Power BI Desktop file?

With SSIS, you have to be careful to export the SSIS files without any sensitive information included. But what about Power BI? If you save the .PBIX files on OneDrive, can you be exposing yourself to a security risk?

Looking at things, it looks like credentials for data sources are stored globally, so one wouldn’t expect them to be in the .pbix files.

image

So, first I turned the PBIX file into a zip file and poked around. I didn’t see anything suspicious.

Next, I ran image

If we open user.zip we find a folder called Credentials, with a single encrypted file inside. I’m willing to bet this is where the passwords are being stored.

image

image

Come see me present!

If you are interested in attending a future precon, I’ll be presenting at the following locations for 2018:

  1. Rochester, March 23rd
  2. Philadelphia, April 20th
  3. Wheeling, April 27th

TSQL Tuesday #100: Industry changes and Meidinger’s Law

MJTuesday

Meidinger’s law

To celebrate the 100th TSQL Tuesday, this month’s image

Maybe a bit image

And what about image

We are all imposters

If you are going to change jobs every two years, then that’s how long you have to learn before it’s on to the next thing.

I’ve had my freakout about the data platform constantly broadening. Mindy Curnutt has a great podcast episode about imposter syndrome. We are all worried about the pace of change.

And I think Meidinger’s law is our saving grace in some sort of way. Things keep changing, we have to keep learning. But how much we actually have to learn is constrained by that 22 year old drinking red-bull with no family obligations.

Throwing Darts

Oh yeah, we were supposed to be predicting the future. Well I think the fact that we are all going to be replaced by that 22 year old some day gives us a hint at the future.

I think more and more things are going to be abstracted away. We’ve seen it with virtualization. We’ve seen it with the cloud. These abstractions mean the new guy can learn new, more important things. He doesn’t have to be intimately familiar with RAID 5. He doesn’t have to have the OSI model memorized.

I think we are seeing it now with data science and machine learning. So much of those areas require a Phd and years and years of study. But things like Azure machine learning and Azure cognitive services are going to get easier and easier. So easy that even the new guy can do it.

T-SQL Tuesday #99: I’m secretly a LARPer

For the 99th T-SQL Tuesday, I’m going to talk about something I do that’s completely unrelated to work. Something I’ve never told any of you about.

MJTuesday

What I don’t want you to know

There are 3 things in my life that could cost me a job, things that I fear an employer ever finding out about. I suffer from 3 big problems in life: depression, diabetes, and LARP. That’s right, I’m… a LARPer.

13305171_10156981353440430_7657738536820278554_o

I’m not kidding about the fear.  People get weirded out easily, and it’s easier to say no to an applicant than to say yes. I really worry about someone finding this post and turning me down.

I once heard a story about a potential staffed employee. Everything was looking good until the client looked up the employee’s Facebook and found out that they were a furry. After that point, the client was no longer interested in staffing that employee.

It’s unfortunate that harmless personal hobbies present such a risk, but here we are.

How it started

When I first heard about it, I was skeptical. In my head, all I knew was the stereotype of the uber-nerd shouting MAGIC MISSILE!
missile GIF

My then fiancée and a couple friends of ours had started going, and she wanted me to come along. I told her quite clearly, “Listen, LARP is so dorky that if I go with YOU, you’ll end up breaking up with ME. No way.”

Well it turned out that my excuse had a limited shelf-life. A couple days after we are married, my new wife reminds me that I’m very much against us getting divorced. So now I have no excuse not to go, because we aren’t breaking up any time soon. We go to LARP a week after we are married.

What is it?

I could tell you it’s Dungeons and Dragons in the woods, but that would be doing it a disservice. Instead, let me tell you a couple stories from Memorial Day weekend, 2016. It was 8 months later, and the start of our honeymoon.

That time I tried to commandeer a flying ship

So my character is a diplomat / minstrel / healer. Which means, if possible, I’d prefer to solve things with words instead of violence. And one of my abilities is to use my charisma to persuade people, convince them we are friends, etc.

So, me and my group are informed by a Non-Player Character that some bandits have taken over his grounded airship, and he needs us to get it back.

13329549_10156981353945430_2087717705991759007_o

We approach the ship, and as we get on the ramp the bandits warn us to stay back. I tell my group, “Let me handle this.”

So I walk up the ramp, alone and in mild danger.
I tell the bandits, “Hey, I’m here to help. That guy you stole this ship from, he’s trying to find adventurers to kill you.”
“We didn’t steal it!”, they reply.
“Fine, the former owner is looking for you.”, I say as I keep walking up the ramp.
”Stay back!” they shout. Then I throw two spell packets at them. Spell packets are basically birdseed wrapped in cloth. This allows for ranged attacks without hurting us or the wild life.

Now the two bandits at the front are charmed and best friends with me. They are trying to convince the rest of the bandits that I’m legit. That they know me from…somewhere?

“Now, here’s how I’m going to help you.” I say as I lean forward, at the top of the ramp. As my foot hits the ground, I hear a loud squeak.

Crap.

Hoooooold!”, we shout. We have to pause the game because something important just happened. I stepped on a trap. An obvious trap. A trap so obvious that the person setting them up expected everyone to see it. Nope, not me. I’m too busy with my silver tongue.

“10 fire damage in a 10 foot radius. That counts as an aggressive action and breaks charisma.”

Crap. I guess we aren’t BFFs anymore.13320412_10156981353955430_161362360380645738_o

I try to re-charisma the one bandit and convince her that she set off the trap. She apologizes profusely, but the rest of the bandits are not convinced and a melee ensues.

Well, at least I tried. Now we have to kill them all. This is what happens when you travel with murderhobos.

Thankfully, all of the dead bandits are very forgiving.

13323354_10156981354860430_1308299216675088895_o

That time my hat was a cauldron, and it saved the swamp

“Keshan, do you know how to featherfall?” I’m asked.
“Sure, I just learned it.” I reply.
“Okay, we need you to climb this tree [metaphorically] with these magic flowers, and then jump out of the tree.”, Angus says.
“No problem.”

I jump and do a twirl and pretend I’m falling out of a tree. Now they can make some magic potion that’s going to cure the swamp of some ancient curse.

Only there is  a problem. “Where is the cauldron?” says the game marshal, “You can’t make a potion without a cauldron.”

Mind you, we are preparing for a town fight, a battle between all of the players and all of the NPCs. As far as our characters are concerned, we could be attacked at any moment.

So I shout, “There’s no time! Zanrick, turn my hat into a cauldron.” Zanrick here is a gnome, and they are a crafty folk. And they have an ability called improvise, which means they can make something into something else if they B.S. well enough.

13329428_10156981353075430_2886636220585355019_o

More shouts go out, “We need an amour patch!”. We end up with 3 of them. Technically they are mason jar lids, but in game they are used to repair your armor after a fight. And suddenly, my hat is a cauldron brewing a magic potion to save the swamp. Pretty cool, right?
13320412_10156981356775430_7653977813504254818_o

The best part of all of it? The game marshal was so delighted by my silliness, that my hat now counts as plate armor in-game. She was just expecting one of us to go to the kitchen and grab a pot. Well, that simply wouldn’t do.

To hell with what everyone thinks

There was a recent conversation on Twitter about how when you are 40, you learn to worry less about what other people think, and you learn to do what you love. I’m not quite 30, and I worry what people will think of me, but damnit I love LARP.

I mentioned depression at the beginning of this post. I usually don’t like to talk about it, because I don’t want to seem like I’m fishing for sympathy. But it’s worth mentioning that one of the causes of depression is ruminating or obsessing over negative thoughts.

In my life there have been only 4 things that have truly gotten me out of my own head and allowed me to stop worrying about things:

  1. Video game programming competitions
  2. Board games
  3. First-person shooters
  4. LARP

That’s it. Those are the only things that allow me to escape for a little while.

But even more than that, LARP is an excuse to turn off my cell phone. It’s an excuse to go outside and walk around. It’s a situation where I’m forced to be hyper-social and meet new friends. It’s this beautiful mathematical dual to everything I do in IT.

I do it to get away. I do it get a break. I do it to make friends.

As I get older, all of those things get harder and harder to do. I may take my work home with me, but there’s at least one place in this world where my work can’t follow me.

One last thing

One last thing, that I should probably mention. So, I might have published a book, in-game. Because why the hell not.

IMG_20180210_182915940

The Mockingbird is a project I did for fun, collecting stories and lore from other players.

And so I’ll end with the introduction from my book. And if you ever come LARP with me, I’ll sell you a copy, for only two and a half gold.

IMG_20180210_182933274

Deploying Power BI: Scaling from 5 to 5000

Today, I had the honor of speaking at the here are the slides.

I want to be clear that this talk isn’t so much about scalability in the performance sense, but more in the IT Governance sense.

Why deployment can be a challenge

Deployments are pretty boring, just like most administration. You just hit publish, right? Figuring out the right solution for you is actually pretty difficult. So why is that?

Too many options

There are at least 9 different ways that you can deploy your Power BI reports:

  1. Sharing Dashboards / Reports
  2. Sharing Workspaces
  3. Organizational content Packs
  4. “Apps”
  5. SharePoint Embedding
  6. Power BI Premium
  7. Publish to Web
  8. Power BI Report Server
  9. Power BI Embedded

So you have all of these different options to choose from and at time it can be confusing. Which method makes sense for your organization?

It keeps changing

Even worse, Power BI is rapidly being iterated on. This is great for users, but a challenge for people trying to keep up with the technology. One year ago the following deployment options modes didn’t exist.

  1. Sharing individual reports (Jan 2018)
  2. “Apps” (May 2017)
  3. SharePoint Embedding (Feb 2017)
  4. Power BI Premium (May 2017)
  5. Power BI Report Server (June 2017)
  6. Power BI Embedded V2 (May 2017)

It can be a real challenge to keep up. I think that a lot of the dust has settled when it comes to deployment options. I don’t see them adding a lot of new methods. But I expect there to be many small tweaks as time goes on. In fact I had to make two changes to my slides this morning because they announced changes yesterday!

Organizing by scale

So, how can we get our arms around all of these different options. How can we organize it mentally?

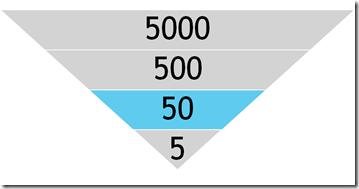
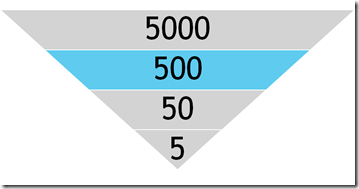
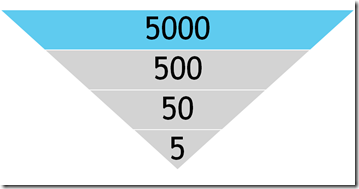
One way of approaching this is who do you want to share with? Do you need to reach 5 users, 50 users, 500 users, or 5000 users?

image

This is the framework that I use in the presentation and the rest of the blog post.

Before we jump into the different ways to deploy your reports, we need to talk briefly about the dirty little secret of self-service BI:

Self-service is code for “undermining IT authority”

Any time you make it easier for Chris in accounting to create and share reports without having to talk to Susan in IT, you chip away bit-by-bit at IT authority This isn’t always a bad thing. Sometimes the process governing your IT strategy is a bureaucracy.

image

The reason I bring it up is that you’ll find that the more users we need to reach, the more of a centralized structure we need to support it. Dashboard sharing is great for 5 users but is horrific for 5000 users. It’s just like building a tower or skyscraper. The requirements for a 10 foot building are drastically different than a 100 foot building.

Sharing with your Team

image

So let’s say you want to share with your team, just a handful of people. Well the good news is it’s pretty easy. You hit publish and you click share.

First you have to publish

Whenever you make a report in Power BI Desktop you have to hit the Publish button to push it out to the Power BI Service, a.k.a PowerBI.com.

image

Whenever you do that, you are going to be asked what workspace you want to push it to.
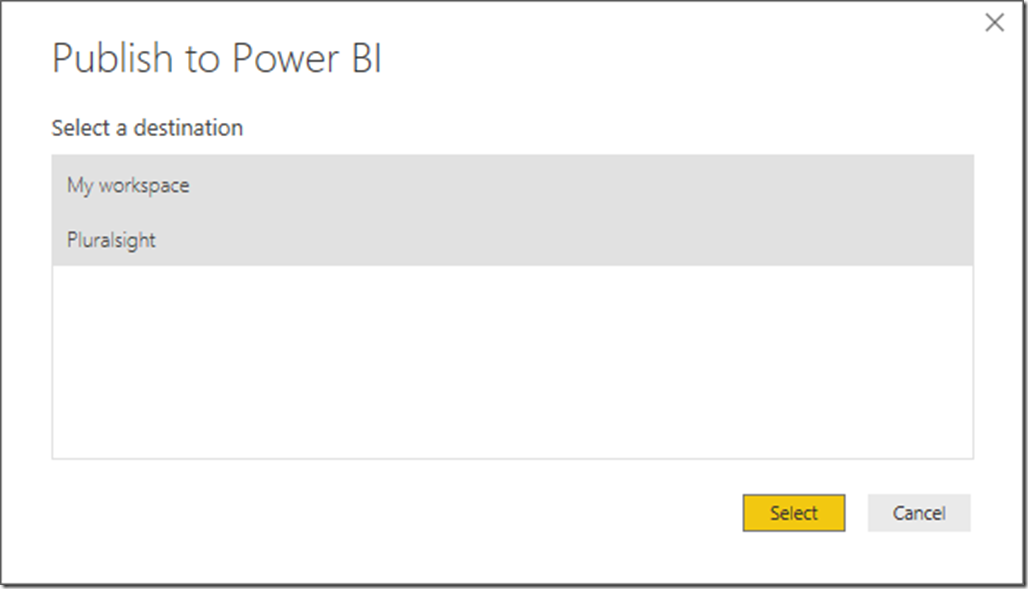
image

A workspace is basically a container for all of your report artifacts: dashboards, reports and data sets.

Dashboard sharing

The quickest and easiest way to deploy reports is direct sharing. Once you’ve published a report, you can create a dashboard by pinning visualizations to it.
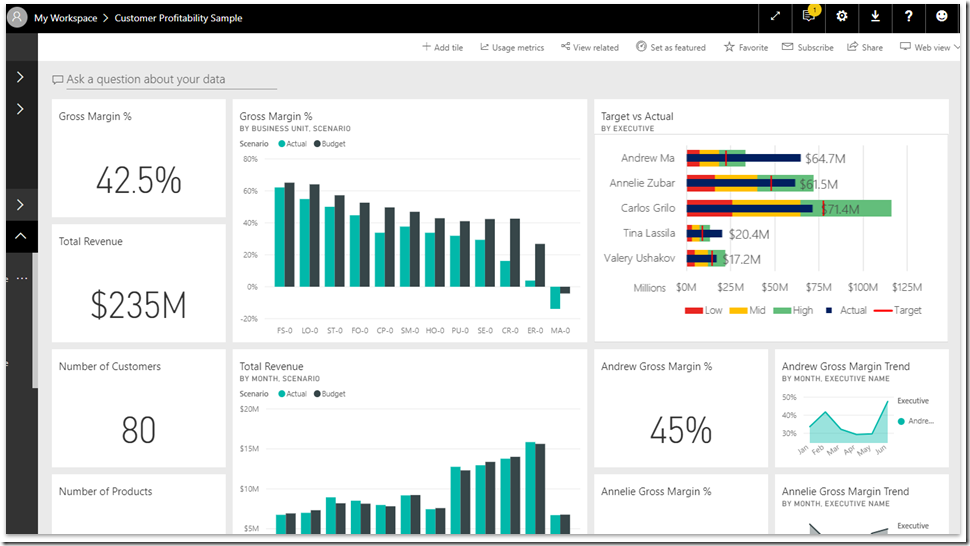
image

One it’s created, then you can hit the share button:

image

From that point you will be asked who you want to add. When you add users to a dashboard you can either given them read-only permissions or the ability to read and share.

Report sharing

Last month, they added the ability to share individual reports as well. The overall process is the same. Upload the report, hit share. The difference is now we can finally do that without creating a dashboard.

Workspace Sharing

So let’s say that you actually want to collaborate with other people on reports, or at the very least keep them all organized in a central location. The quickest and easiest way to do that is to share the whole workspace.

When you share a workspace you can make people either admins or members. You can also decide if you want those members to be read only, or able to edit the contents of that workspace.

This is ideal for collaboration or sharing with small groups. But if you have to support 100 users, it can start to break down, especially if all the members have edit privileges. Let’s take a look at the next level of scale.

Sharing with Power BI Users
image

Okay, you’ve been able to share with a handful of users. But now, you need to deploy “production” reports. This means having some sort of QA processes and a way to centrally manage things. We need to step up our game.

Organizational content packs

Organizational content packs were the original way of wrapping Power BI content in a nice bow and sharing it with the whole organization. Unfortunately they are now deprecated and have been mostly replaced by apps. Mostly.

The one use case for content packs is for user customizations. Whenever you share an app, the user gets the latest version of that app. With content packs, a user can download the pack and make personalization’s to their copy.

Business Intelligist has a good post breaking down some of the differences.

Power BI Apps

Power BI Apps are the definitive way to share content within your organization. A Power BI app is essentially a shared workspace with a publish button and some nice wrapping around it.

Apps provide a number of benefits:

  • QA and staging. Review your reports before deploying.
  • Selective staging. Work on reports without having to publish them.
  • Professional wrapping. Add a logo, description and landing page to your content.
  • Canonical Versioning. By using vehicles like Apps, you can have company endorsed reports.

To Share an App, you hit publish and are given a URL to distribute. Users can also search for your app. In the future, you will be able to push content out to your users directly.

Sharing with your whole organization
image

So let’s say that you want to expand your reach and share reports with everyone in the entire organization. In that case you will either need to a) change your licensing approach, b)move away from powerbi.com, or c) both.

Power BI Premium

Power BI Premium is ideal if you have lots of users and lots of money. With Premium, instead of licensing users you license capacity. You are essentially paying for the VMs behind power bi service instead of the individual users viewing the content.

Power BI Premium is a licensing strategy, not a deployment strategy. The deployment is secondary.

Remember what I said about lots of money? The full Power BI Premium SKUs start at $5000 per month. If you are paying $10 per user per month, the break-even starts around 500 users. That’s a lot of users.

From a user experience perspective standpoint, absolutely nothing changes with changes. you mark a workspace as premium, and now it’s isolated and free to users.

image

Image source: Microsoft

Power BI Premium also offers scalability benefits. Larger data sets, better performance, more frequent refreshes. If you are bumping up against the limits of the Power BI Service, Power BI Premium might make sense for you. The whitepaper goes into much more detail.

SharePoint Online Embedding

If your organization has made heavy investments in SharePoint, it may make sense to use SharePoint as the front-end instead of powerbi.com

To deploy a report to SharePoint Online, crate a new page and then add the Power BI Web Part.
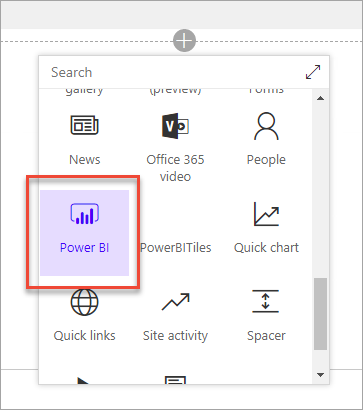
Image Source: Microsoft

Once you add the web part, you have to specify the URL of your report and you are done.

From a licensing perspective, users with need to have Power BI Pro, or you can use the EM SKUs of Power BI Premium. The EM levels with cost you $625-$2495 per month.

Power BI Report Server

EDIT: This section is incorrect and will be updated. Please see David’s comment at the bottom.

For a long time, the #1 requested feature was Power BI on-premises. Power BI Report Server is basically SSRS with support for rendering Power BI reports. The deployment story is very similar to SSRS reports. Users would go to the web portal and open up reports from there.

Unless you have data sovereignty regulations or highly confidential data, you shouldn’t use Power BI Report Server. The first reason is that it is very expensive. There are two ways to get Power BI Report Server:

  • Licensing is included with Power BI Premium
  • SQL Server Enterprise Edition + Software Assurance

The other issue is that Power BI Report Server is that it is still limited:

  • No support for Dashboards
  • No support for Scheduled Refresh
  • No Q/A or Cortana support

I expect that they are going to continue to improve upon PBI Report Server, but as with an on-prem solution, it’s always going to be lagging behind the SaaS model.

Sharing with everyone
image

So let’s say that you want to go a little bit broader, what if you want to share with people outside of your organization. What if you want to share with everyone?

Publish to Web

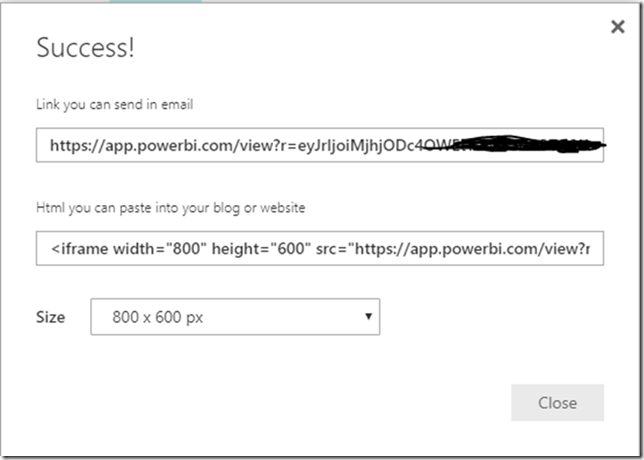
The simplest and easiest way to share with people is to use Publish to Web.  When you publish a report you will be given a public URL and an iframe for embedding.
image

If you use publish to web, it’s completely free to anyone to view. However, your data is publicly available. Anyone with access to the URL can view the underlying data. If this sounds bad, be aware that you can disable publish to web at the tenant level or for specific security groups.

Power BI Embedded

To use Power BI Embedded, you are going to need a web developer. There are no two ways about it. And web developers are expeeeensive.

image

Power BI Embedded allows you to use Javascript to control and embed Power BI reports in your web application. One of the consequences of using Power BI Embedded id you are going to have to roll your own security. You aren’t going to be giving users access like normal.

The other thing to know about Power BI embedded is that it depends on Power BI Premium to back it. So you are paying for capacity, not users. In this case you are using the A SKUs, which cost $725-$23,000 per month. That will get you 300-9600 render per hour.

If you want to start playing around with it, there are samples available.

External Sharing

While this isn’t a way to share with thousands of external users, it bears mentioning that you can share with external users. This is ideal if you have a handful of external clients. The overall user experience is largely the same. The big difference is that their account can live in a different Azure Active Directory tenant.

I won’t go into detail about it here, but check this link out if you want to learn more. There is also a whitepaper (AAD B2B) that goes into even more detail.

What now?

If you head isn’t spinning from all the information, definitely check out the deployment whitepaper. Chris Webb and Melissa Coates go into excruciating detail into all of your options and all the different details to consider.

Power BI Precon Wrap-up, Cleveland 2018

This weekend, I had the honor of presenting my Power BI precon for SQL Saturday Cleveland. I’ll be giving the same presentation March 16th in Cincinnati.

Inevitably, there are always some questions that I don’t have an answer for.  What I like to do is circle back and try to get some answers for the people who attended.

Do clustered data gateways provide load balancing?

Back in image

That being said, I created a view in the main database pointing to a different database and there wasn’t any issue. Going further, I decided to test out picking on database and hand typing a query pointing to a different database.

image

And it works! It’s very interesting, I wonder where the limitations comes from if it’s so easy to get around.

What’s the best way to connect to a Web API application?

One attendee said they use ASP.net Web API as middleware for a large number of databases and tables. So what is the best way to connect to Web API for Power BI?

Steve Howard has a great blog post about different options. Probably the best option is to add OData support to your Web API.

If the API is complex and OData is not an option, custom data connectors are worth looking into. You’ll be writing a lot of M code, but it can be a good way to encapsulate that complexity.

Does Power BI support SAP Universe?

So the situation for SAP Universe is a bit weird. Back in 2014 they added support for SAP Business Objects.

But then later they removed it because of licensing concerns? It’s not entirely clear to me. That being said, there is a request for support to be added back.

Digging a bit deeper, it sounds like there might be a workaround using the SAP OData API, but that’s not the ideal solution.

What are the best options for sharing reports with external customers?

A question I here a lot is how do you share with customers and deal with multi-tenant databases.

Well very recently, back in November 2017, Power BI added support for external users with Azure B2B. This includes support for row-level security, which means you can have all your data in a central database and limit a customer to just their own data. This is very exciting.

There is a whitepaper if you want to learn more.

Power BI Desktop files are smaller now

I was working on a demo for my upcoming Pluralsight image

It used to be that you could look at the data model and see a version number.

image

But now, it’s almost entirely unintelligible. The only thing you can read is “This backup was created using xpress 9 compression.”

image

A little image

When imported into power bi Desktop, the new compression model is dramatically more efficient. 184 KB versus 2,288 KB.

image

What I haven’t figured out yet is if this impacts in-memory use or just when it’s saved to disk. Still it’s nice to see Microsoft continuing to make improvements.

Power BI Precon: Implementing the other 90%

Last year I got to do a Precon on Power BI for the Pittsburgh SQL Saturday. This year I’m honored to be presenting at Cleveland and Cincinnati. This time I thought it would make sense to have a blog post summarizing what’s covered.

One of the things that I found frustrating when I first learned about Power BI, was all of the behind the scenes stuff. It was easy to find information about charts and graphs, but less so about how everything fits together. This precon focuses on two main areas: data wrangling, and administration.

Session 1: Database Theory

Because Power BI is aimed at business users in large part, there are many people using it who don’t have a traditional data background. This means it’s worth touching on some of the fundamentals such as primary keys, normalization and star schema.

The most important things to understand when modeling for Power BI, is that it’s optimized for star schema in particular and filtering/aggregating in general. That fact that it’s a columnar database means it can handle a certain amount of flattening/denormalizing gracefully, because it has really good compression.

Session 2: Power Query

One of the things that can be confusing is that it has 2 different data manipulation languages, M and DAX. (3 languages if you could R!). So a question that comes up a lot is when to use which language.

Power Query is designed for business users primarily, especially since it started as an Excel add-in. In fact the official Microsoft litmus test is that is was designed for users who get value from the excel formula bar in their work. As a result, it has a strong GUI component, but is really basic in a lot of ways.

The way I like to think of it is “Anything you could pay someone minimum wage to do in Excel, you can automate in Power Query.” Power query is all about basic clean up and data prep. You aren’t going to be adding a lot of meaning to the data.

Session 3: DAX

DAX is the language you are going to use to model your data and add meaning to it. DAX is deceptively simple, looking very similar to Excel formulas. In reality, the learning curve on DAX can be quite painful, because it requires thinking in terms of columns and filters, not in terms of rows.

Session 4: Data Gateways

Data gateways are the way that you bridge the cloud Power BI service to whatever data lives on premises. Installation and configuration is pretty simple overall. Data Gateways allow for schedule refreshes of your data up to the cloud.

One thing that’s worth knowing are the alternative query methods available it gateways. By using DirectQuery or live connections, you can query live data without having to export it all to the cloud.

Related course: Leveraging Timely On-premises Data with Power BI

Session 5: Licensing and deployment

With power BI, generally you are going to be buying pro licenses for all of your users, at $10 per month. However there are other licensing scenarios such as Power BI Reporting server and Power BI Premium. But you are probably going to be going with the pro license.

There are so many was to publish Power BI reports:

  1. Personal workspaces
  2. App Workspaces
  3. Organizational content packs
  4. Publish to web
  5. Sharepoint
  6. Power BI Premium
  7. Power BI Embedded
  8. Power BI report server

It can get a bit difficult to keep up with all of the options.

Session 6: Security and Auditing

There are three big pieces to securing Power BI: What data can be access, what reports can be accessed and what can people share. In addition to that, there are interesting features with row-level security built in to Power BI as well as SSAS.

In terms of auditing, much of that is going to be based on the Unified Audit log for Office 365, which requires some work to enable. There are also things you can do with PowerShell and with auditing data gateways.

Overview

Overall I’m pretty proud of the contents. This is the kind of precon I wish I had been able to attend 3 years ago so I had an idea of what I was doing.

Building a DBA Salary Calculator, Part 0: Initial findings

I’m planning on building a salary calculator based on the data from played around with some of the numbers earlier. This time I’m planning on going a lot deeper.

I want your help and feedback! I want to know what would make a calculator most useful to you. Feel free to poke holes in my methodology and tell me how a real data scientist would handle this project.

In this post, I’m going to outline some initial findings as well how I’m planning to approach this project. All of the information below is based on a narrow subset:

  • USA, full postal code
  • DBA job
  • Between $15,000 and $165,000

Regarding zip codes, some people only entered a portion of their zip for privacy sake. In the final analysis, I plan on taking into account the ~200 US individuals who did that.

Initial findings

The data isn’t very predictive

So I’m using something called a multiple linear regression to make a formula to predict your salary based on specific variables. Unfortunately, the highest Coefficient of Determination (or R2) I’ve been able to get is 0.37. Which means, as far as I understand it, that at most the model explains 37% of the variation.

Additionally the spread on the results isn’t great either. The standard deviation, a measure of spread, is about $25,000 on the original subset of data. Which means we’d expect 68% to be within +/- $25,000 of the average and 95% to be within +/- $50,000 of the average. So what happens when we apply our model?

When we apply the model we get something called residuals, which are basically the difference between what we predicted and what the actual salary was. The standard deviation on those residuals is $20,000. Which means that our confidence range is going to be +/- 20-40k. That to me doesn’t seem like a great range.

There are a few strong indicators

Let’s take a look at what we get when we do a multiple regression with the Excel Analysis ToolPak addin:

image

The two biggest factors by far seem to be how long you’ve worked and and where you live. In fact, we can explain 30% of the variance using those two variables:

image

The two other variables that are very strong are whether you telecommute and whether you are independent. When we add those, our adjusted R2 goes up to 33%.

Then after that we have a handful of variables that have a less than 5% chance of being erroneous:

  • Gender. It’s still a bit early to jump to conclusions, but it looks like being female might cost you $6,000 per year. This is after controlling for years of experience, education, hours worked, and if this is your first job. Gender could still be tied to other factors like a gap in your career or if you negotiate pay raises.
  • First Job. “First job” I identified as having identical values for years of experience and years in this job. If you haven’t changed jobs, it could be costing you $4,000, which lines up with my personal experience.
  • Hours worked per week. This is basically what you would expect.
  • Education. This is the number of years of education you received outside of high school.
  • Build Scripts and automation. One of the tasks people could check was if they are automating their work. Out of all the tasks people could list, this seems to have the biggest impact.

There are some interesting correlations

Part of doing a multiple regression is making sure your variables aren’t too strongly correlated or “collinear”. As part of this, is possible to find some interesting correlations.

  • If you are on-call, you are less likely to have post-secondary education. You are also probably overworked and learning PowerShell (no surprise there).
  • Certifications correlate negatively with being a dev-dba instead of a production dba.
  • If this is your first job, you are less likely to be working more than 40 hours per week. Maybe that $4,000 paycut is worth it Winking smile
  • Independents also work less hours per week. So maybe your second job should be going independent.
  • If you telecommute, you might make $2,000 more per year for every day of the week you telecommute; but you are going to be working more hours as well.

Plans moving forward

So here is the current outline for this blog series:

  1. Identifying features (variables)
  2. Data cleanup
  3. Extracting features
  4. Removing collinear features
  5. Performing multiple regression
  6. Coding a calculator in Javascript
  7. Reimplementing everything in R

So let me know what you think. I plan on making all of the data and code freely available on github.

T-SQL Tuesday #98: Learning Troubleshooting from Games


TSQLTues

This week’s T-SQL Tuesday is about a time that you solved a difficult technical problem. Unfortunately my brain doesn’t store events that way, so I can’t think of any good stories. Instead, I want to talk briefly about how games have made me a better programmer and a better troubleshooter.

Map-making in TFC

TFC Boxart.png

The first game I want to talk about is Team Fortress Classic. It’s a team based shooter from the late 90’s. I used to play this game all the time. But I did even more than that, I would make custom levels to play on with other people.

Mapmaking for TFC, was generally a simple process. You would create simple polyhedrons and then apply textures/patterns to them. Then you would place non-terrain objects, called entities, inside of your terrain. Everything is pretty straightforward…until you get a leak.

A leak is when the outside of the level is accessible to the inside of the level. Imagine you are building a spaceship or a submarine, if you have a leak it just won’t work. The challenge is that the level editor won’t tell you where you have a leak1. So how do you solve it?

In my case, you encase half the level in solid rock, so to speak. I would just make a big cube and cover up half of the level. If the level compiled, I knew my leak was somewhere in that half. Then I just kept repeating with smaller and smaller cubes.

I do the same thing all the time in my professional life. I’ll comment whole swathes of code. I’ll jump to half-way to the data pipeline to see where the error starts. TFC taught me to keep cutting the problem in half until I find it.

Guessing the secrets of the universe with Zendo

Image result

Undoubtedly proof that I was destined to be a programmer, one of my favorite board games ever is Zendo. It was actually one of my nicknames in college. It’s got a silly theme about discerning if something has the Buddha nature. In reality, it boils down to one player making up a rule, and everyone else trying to determine what the rule is.

If it sounds easy, I dare you to play something similar over at the New York Times. Chances are you are going to get it wrong.

The biggest thing Zendo taught me, was fighting against confirmation bias. It taught me to ask “What would prove my theory wrong”. Good troubleshooting involves guessing a cause, determining a test that will give you new information, and then running that test.

That test might be running a simpler version of a query that’s failing. It might mean adding a breakpoint to your code and inspecting variables.

Learning how to think systematically about this sort of thing has been tremendously useful.

Learning outside of programming

Troubleshooting is very often a set of skills and approaches that don’t need to do anything with technology per-se. I think looking at how we can get these skills in other places, like games can be very useful.

Speaking of other sources, there are two book I can recommend wholeheartedly. The first is How to Solve It which is about how to solve mathematical problems, but it provide a number of ways to break down a problem or approach it from different angles. The second is called Conceptual Blockbusting. It focuses on the nebulous issue of how we think about problem solving. It’s very much a book about thinking and I definitely enjoyed it.

Footnotes

1 Only after writing this blog post did I find an article explaining out to get the level editor to tell you exactly were the leak is. Sigh.

Practicing Statistics: Female DBAs and Salary

Brent Ozar recently ran a salary survey for people working with databases, and posted an article: Female DBAs Make Less Money. Why?

Many of the responses were along the lines of “Well, duh.” I, personally,  felt much of the same thing.

But, I think with something like this, there is a risk for confirmation bias. If you already believed that women were underpaid, there is a chance that you’ll see this as more proof and move on, without ever questioning the quality of the data.

What I want to do is try to take a shot at answering the question: How strong is this evidence? Does this move the conversation forward, or is it junk data?

Consider this blog post an introduction into some statistics and working with data in general. I want to walk you through some of the analysis you can do once you start learning a little bit of statistics. This post is going to talk a lot more about how we get to an answer instead of what the answer is.

Data Integrity

So, first we want to ask: Is the data any good? Does it fit the model we would expect? Barring any other information I would expect it to look similar to a normal distribution. A lot of people around the center, with roughly even tails on either side, clustered reasonably closely.

So if we just take a histogram of the raw data, what do we get?

image

So, we’ve got a bit of a problem here. The bulk of the data does look like a normal distribution, or something close to it. But we’ve got some suspicious outliers. First we have some people allegedly making over a million dollars in salary. That’s why the histogram is so wide. Hold on, let me zoom in.

image

Even ignoring the millionaires, we have a number of people reporting over half a million dollars per year in salary.

image

We’ve also got issues on the other end of the spectrum. Apparently there is someone in Canada who is working as an unpaid intern:

image

Is this really an issue?

Goofy outliers are an issue, but the larger the dataset the smaller the issue. If Bill Gates walks into a bar, the average wealth in the bar goes up by a billion. If he walks into a football stadium, everyone gets a million dollar raise.

One way of looking at the issue is to compare the median to the mean. The median is the salary smack dab in the middle, whereas mean is what we normally think of when we think of average.

The median doesn’t care where Bill Gates is, but the mean is sensitive to outliers. If we compare the two, that should give us an idea if we have too much skew in either direction.

image

So, if we take all of the raw data we get a $4,000 difference. That feels significant, but could just be the way is naturally skewed. Maybe all the entry level jobs are around the same, but the size of pay raises get bigger and bigger at the top end.

Averages after removing outliers

Okay, well lets take those outliers out. We are going to use $15,000-$165,000 as a valid range for salaries. Later on I’ll explain where I got that range.

There are 143 entries outside of that range, or about 5% of the total entries. I feel comfortable excluding that amount. So what’s the difference now?

image

So the middle hasn’t moved, but the mean is about the same now. So this tells me that salaries are evenly distributed for the most part, with some really big entries towards the high end. Still, the $4,000 shift isn’t too big, right?

Wait, this actually is an issue…

Remember when I said 2 seconds ago that $4,000 was a significant but not crazy large? Well, unfortunately the skew in the data set really screws up some analysis we want to do. Specifically, our friend Standard Deviation. We need a reasonable standard deviation to do a standard error analysis, which we cover later.

Standard Deviation is a measure of the spread of a distribution. Are the numbers clumped near the mean, or are they spread far out? The larger the standard deviation, the more variation of entries.

If a distribution is a roughly normal distribution, we can predict how many results will fall within a certain range: 68% within +/- 1 standard deviation, 95% within +/- 2 deviations, 99.7% within 3 deviations.

Well, because of the way standard deviation is calculated, it is especially sensitive to outliers. In this case, it’s extremely sensitive. The standard deviation of all the raw data is $66,500 . When I remove results outside of $15-$165K, the standard deviation plummets to $32,000. This suggests that there is a lot of variability in the data being caused by 5% of the entries.

So let’s talk about how to remove outliers.

Removing Outliers

Identifying the IQR

Remember when I got that $15,000-$165000 range? That’s by using a tool called InterQuartile Range or IQR.

It sounds fancy, but it is incredibly simple. Interquartile range is basically the distance between the middle of the bottom half and the middle of the top half.

So in our case, if we take the bottom half of the data, the median salary is $65,000. If we take the top half of the data, the median salary is $115,000. The IQR is the difference between the two numbers, which is $50,000.

Using IQR to filter out outliers

Okay, so we have a spread $50,000 between the first and third quartiles. How do we use that information? Well there is a common rule of thumb that anything outside +/- 1.5 IQR is an outlier. In fact, when you see a boxplot, that is what is going on when you see those dots.

So, $50,000 *1.5 is $75,000. If we take the median ($90,000) and add/subtract 75,000 we get our earlier range of $15,000-$165,000

Standard Error Analysis

Okay, so why did we go through all that work to get the standard deviation to be a little more reasonable? Well, I want to do something called a Standard Error Analysis to answer the following question:

What if our sample is a poor sample?

What is our average female salary is lower because of a sampling error? Specifically, what are the odds that we samples a lower average salary by pure chance? “Poppycock!”, you might say. Well, standard error gives us an idea of how unlikely that is.

Importance of sample size

Let’s say there are only 1,000 female DBAs in the whole world, and we select 10 of them. What are the chances that the average salary of those 10 is representative of the original 1,000? It’s not great. We could easily pick 10 individuals from the bottom quartile, for example.

What if we sampled 100 instead of 1000? The chances get a lot better. We are far more likely to include individuals that are above average for the population as a whole. The larger the sample, the closer the sample mean will match the mean of the original population.

The larger the sample size, the smaller the standard error.

Importance of spread

Remember before we said that a reasonable standard deviation is important?  Let’s talk about why. Let’s say there are 10 people in that bar, and that the spread of salaries is small. Everyone there make roughly the same amount. As a result the standard deviation, a measure of spread, is going to be quite small.

So, let’s say you take three people at random out of that bar, bribe them with a free drink, and take the average of their salaries. If you do that multiple times, in general that number is going to be close to the true average of the whole population (the bar).

Now, Bill Gates walks in again and we repeat the exercise three times. Because he is such an outlier, the standard deviation is much larger. This throws everything out of whack. We get three samples: $50,000, $60,000, and $30,000,000,000. Whoops.

The smaller the standard deviation of a population, the smaller the standard error.

Calculating Standard Error

Getting the prerequisites

To calculate the standard error, we need mean, standard deviation and sample size. Before we calculate those numbers, I want to narrow the focus a bit.

I’ve taken the source data, and narrowed it down to US, DBA and within $15,000-$16,5000. This should give us more of an apples to apples comparison. So what do we get?

image

We’ve got a gap in average salary of about $4,500.  This seems quite significant, but soon we’ll prove how significant.

We’ve also a standard deviation of around $24,500. If salaries full under a normal distribution, this means that 95% of DBA salaries in the US should be within $52,500-$151,000. That sounds about right to me.

Calculating individual standard error

So now we have everything we need to calculate standard error for the female and male samples individually. The formula for standard error is standard deviation divided by the square root of the count.

So for females, it’s 23,493 / sqrt(123) = 2118. This means that if we were only sampling female DBAs, we would expect the average salary to be within +/- $2,118  about two thirds of the time.

image

So, if we were to randomly sample female DBA’s, then 95% of the time, that sample’s average would be less than the male average from before.

image

That seems like a strong indicator that the lower average salary for females isn’t just chance. But we actually have a stronger way to do this comparison.

Standard error of sample means

Whenever you want to compare the means from two different samples, you use a slightly different formula which combines everything together.

The formula is SQRT( (Sa^2 + Sb^2) / (na +nb)) . S is the standard deviation for samples a and b. Standard deviation squared is also known as the variance. N is the count for samples a and b.

If we combine it all together we get this:

image

The standard error when we combine samples is $1,154. This indicates that if there was no difference between the distribution in female and male salaries, then 68% of the time they would be within $1,154.

Well in this case, the difference in means is almost 4 times that. So if the difference in means is 3.88 standard deviations apart, how often would that happen by pure chance? Well, we would see this level of separation 0.01% of the time, or about 1 in 10,000.

Conclusion

I take this as strong evidence that there is a real wage gap between female and male DBAs in the USA.

What this does not tells us is why. There are a number of reasons that people speculate as to the cause of this gap, many in Brent’s original blog post and the comments below it. I’ll leave that to them to speculate what the cause is.

css.php